Translation under review. The illustrations are still in Portuguese.
"If it's going up, it's because people are buying. If it's going down, it's because people are selling. Simple. There's no other secret."
You stopped in the middle of this chapter.
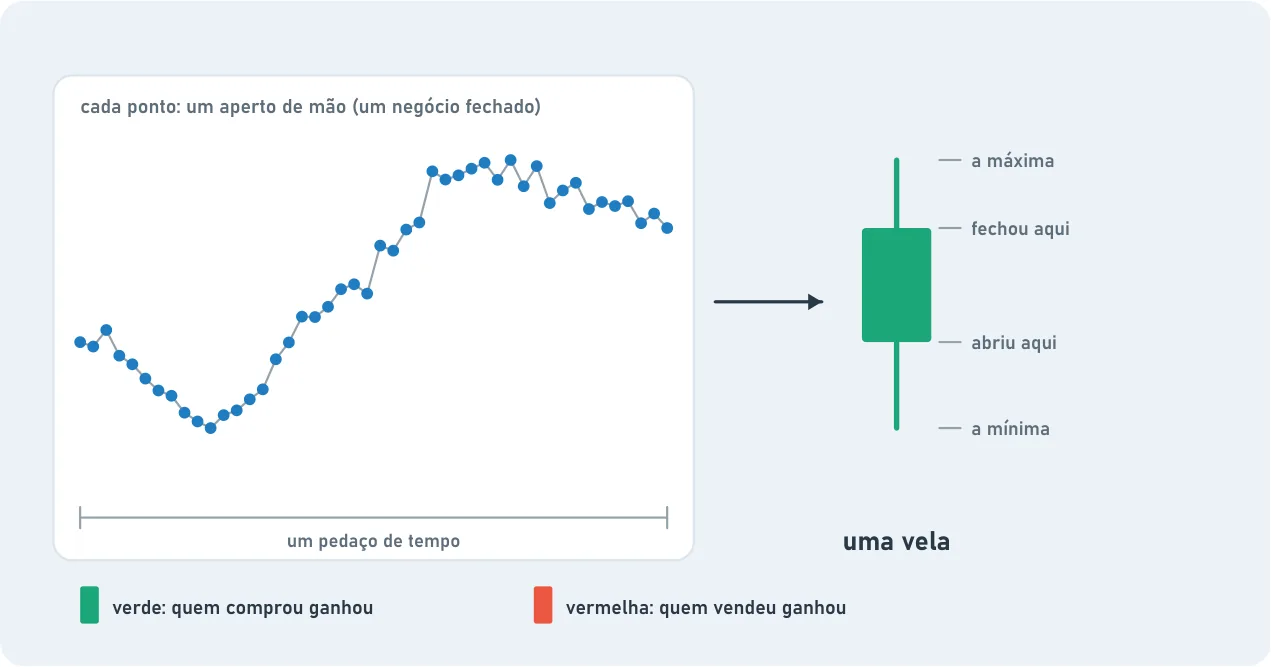
Remember the handshakes? Each closed deal becomes a price. If you write down all those prices, one after the other, and draw them, you have a chart. That's what the chart is: the list of every handshake, drawn out.
Nobody made up this drawing. It's the trail of what millions of people did. When the chart moves, something moved in the real world.
Why it matters. Nobody knows everything that's going on in the market. Not even the biggest bank in the world. But everyone who bought or sold left their mark on the chart. It's the only place where everything shows up.
The . The chart we use is made of candles. Each candle sums up a stretch of time: a day, an hour, five minutes. Green: the buyers won the fight in that period. Red: the sellers won.
What comes in Level 2. This is where the market ends and the chart begins. In Level 2 you'll learn to read the candle and, above all, time: why the five-minute chart and the monthly chart are the same chart, seen from different distances. It's the part that surprises beginners the most.
Words in this chapter
Candle
A bar that sums up the price over a period: open, high, low and close.