Translation under review. The illustrations are still in Portuguese.
"I don't even know the names of the candles."
You stopped in the middle of this chapter.
A candle is a stretch of time. Each candle marks the price where that stretch of time opened and the price where it closed. It can be one minute, one day, one week. The candle works the same way.
Three stories, only three. Every candle tells one of them: people bought more, people bought less, or it was a tie. There's no fourth one.
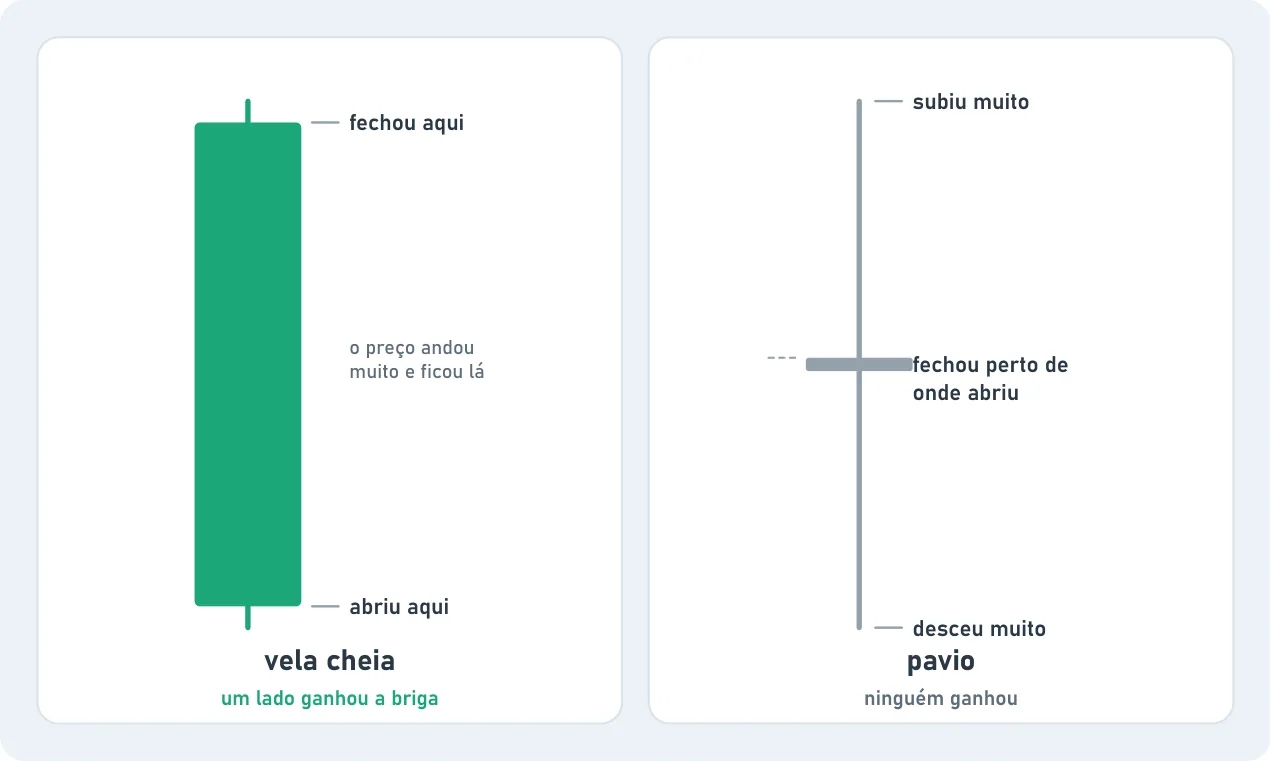
Full-body candle or wick. That's all you need to know about candles.
Full-body candle: long and colored. The price moved a lot and stayed there. One side won the fight.
Wick: a line with almost no color. The price went way up, went way down and closed near where it opened. Nobody won.
We don't trade by reading candles, because it's very easy for a bank or a bot to manipulate a candle, except on the weekly chart.
— Sam
What about the names? There are dozens of candle names. This book doesn't use any of them. You'll see those names in videos and in other books. That's fine. Here we look at whether the candle is full-body or a wick, and which it's on.
What about volume? You'll see volume on almost every chart. This book doesn't use it. The price of an asset changes, so the amount of money needed to buy the same number of shares changes too, and volume stops saying what it seems to say. We look at the price.
Words in this chapter
Timeframe
The time span of each candle: 5 minutes, 1 hour, 1 day.