Translation under review. The illustrations are still in Portuguese.
"The chart is a drawing that's constantly being drawn. It never stands still."
You stopped in the middle of this chapter.
You're not the same as you were an hour ago. A comparison: you get a haircut and you change. You change clothes and you change. The chart is similar: it changes every second, because the world changes every second.
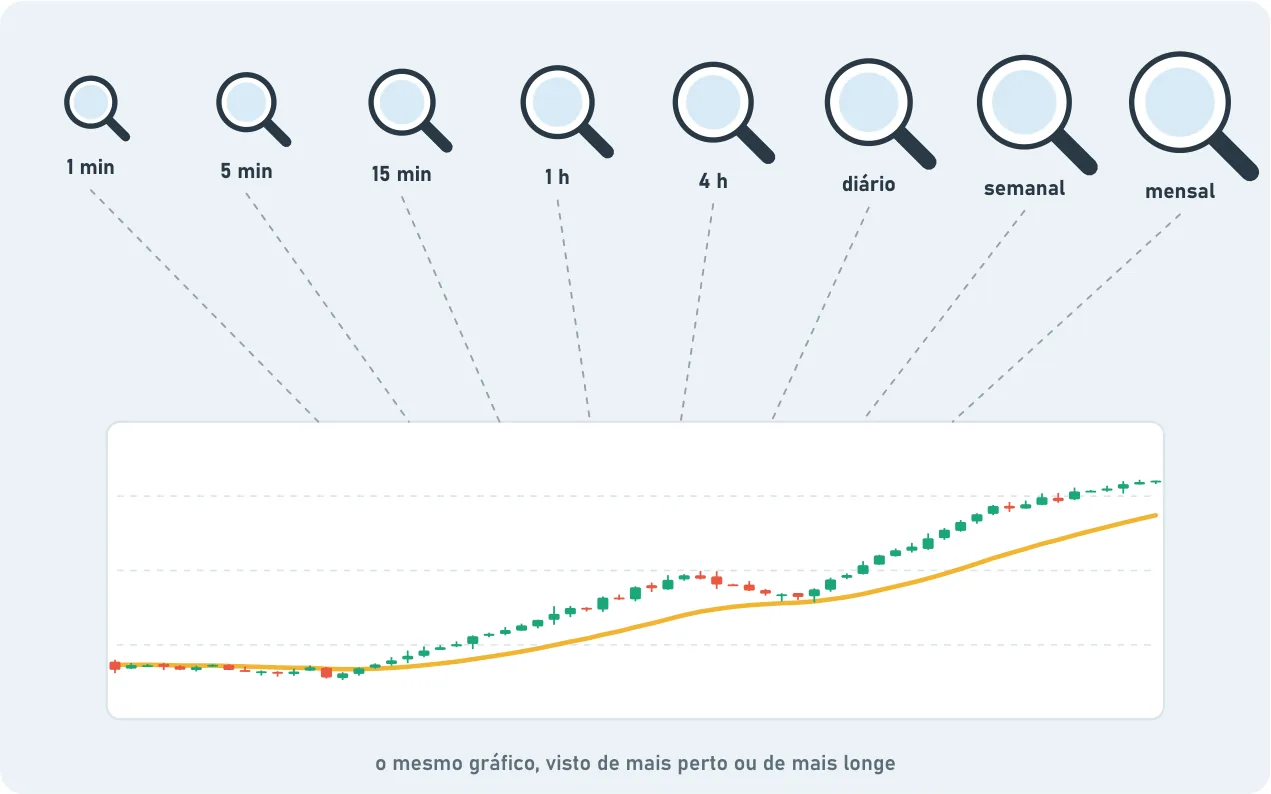
Several magnifying glasses. That's why you can look at the same chart in different stretches of time. On the 5-minute chart, each candle is five minutes. On the daily, each candle is one day. On the weekly, one week. Think of each timeframe as a magnifying glass (it's just a comparison): the same thing, seen up close or from farther away.
Who looks at what. Bots look at the 1-second chart. look at 1, 5 and 15 minutes. Swing traders look at the 4-hour, the daily and the weekly. But anyone can look at any timeframe.
Use all of them. There's no required order. But it's the bigger chart that gives the context. Before you decide, zoom out: pull the chart back and see if there's a , where the mood is heading. The small chart shows the detail: the exact price where things happen. Each one informs the other, both ways.
It doesn't matter. I use every timeframe there is.
— Sam
If you want to know...
Look at...
if there's a trend
a bigger timeframe, like the weekly or the daily
if the mood is good today
the daily or the 4-hour
the exact price for an entry
a smaller timeframe, like 15 or 5 minutes
Don't fight the big chart. If the big chart is falling hard, buying because the small one ticked up a little is what's called "trying to catch a falling knife". It's just an image, but it says it all: whoever tries cuts their hand.
Words in this chapter
Day trading
Buying and selling the same asset on the same day.
Trend
The main direction of the price over a period: up, down or sideways.