Translation under review. The illustrations are still in Portuguese.
"Now that we know what a chart is, we need to learn to read a chart. The most important thing, the most basic: trend."
You stopped in the middle of this chapter.
Is there a or not? That's the first question for any chart. A trend is when the price is going up or down in a way you can draw as a direction, and it will probably keep going that way.
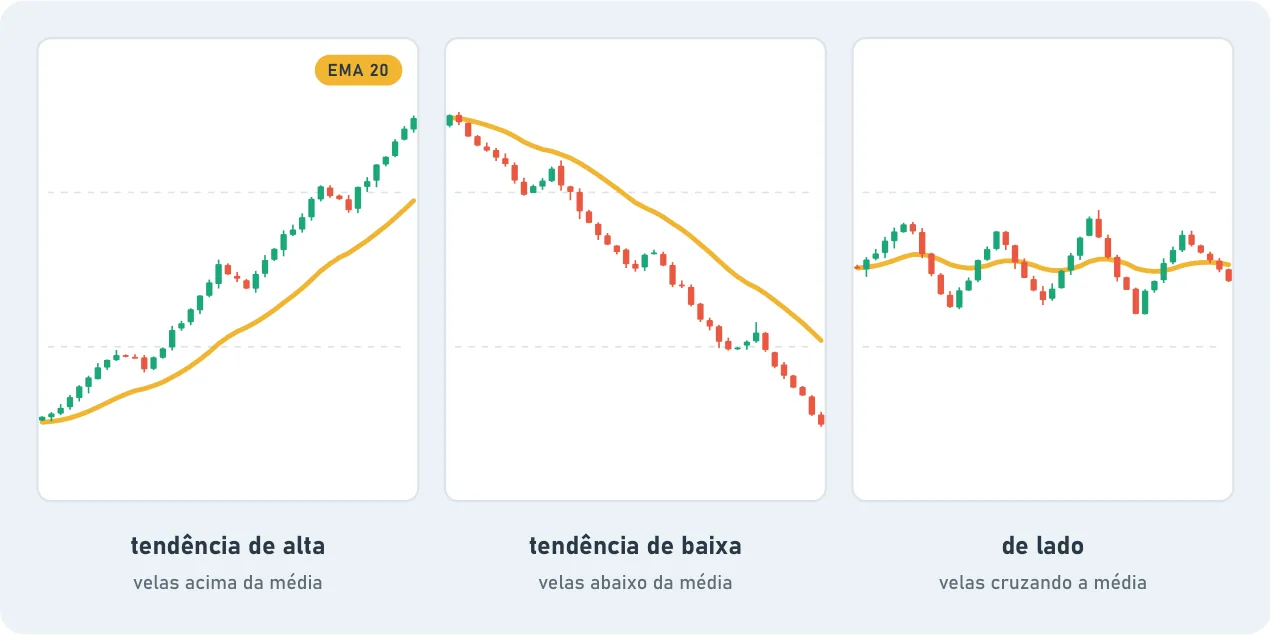
The line that comes already drawn. You can draw the trend by hand (next chapter) or let the chart draw it for you. That's what the moving average does. The 20 EMA is the average price of the last 20 , turned into a smooth line on top of the chart.
If it's holding above the average, it's probably in an uptrend. If it's holding below, it's probably in a downtrend.
— Sam
Its name. On the chart it shows up as EMA 20: the 20-period exponential moving average. "Exponential" just means the most recent candles weigh more in the math. You don't need to do any math: the chart does it.
On any . Remember fractals? The 20 EMA works on all of them. On the weekly it shows the mood of the last few months. On the daily, of the last few weeks. On the 15-minute, of the last few hours.
20 or 12? Some people prefer the 20 EMA, some prefer the 12. The 12 EMA sticks closer to the price and reacts faster. The 20 EMA is calmer. There's no mathematical certainty about which one is right. Each asset does its own thing, plays its own rhythm, and respects one or the other more. Add both and watch which one the price of the asset you follow respects more.
Words in this chapter
Trend
The main direction of the price over a period: up, down or sideways.
Candle
A bar that sums up the price over a period: open, high, low and close.
Timeframe
The time span of each candle: 5 minutes, 1 hour, 1 day.