Translation under review. The illustrations are still in Portuguese.
"You basically draw a line, and that asset will probably follow that line."
You stopped in the middle of this chapter.
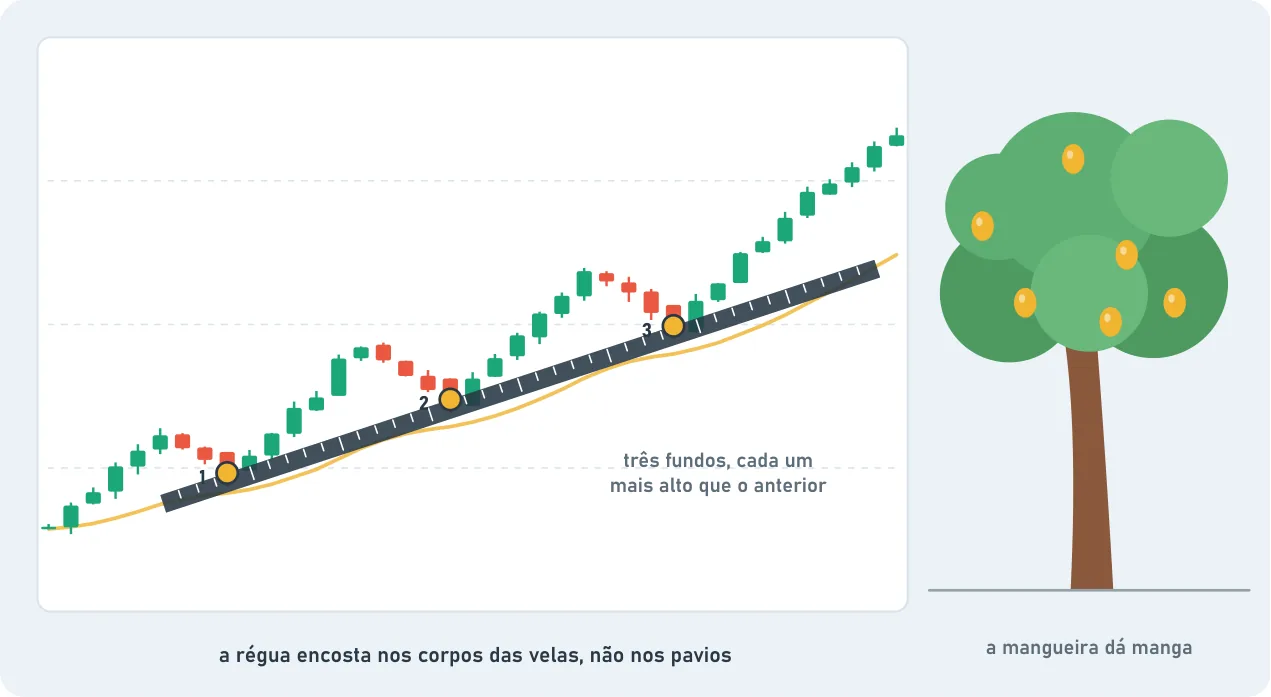
Connect the dots. A trendline is a ruler you lay on the chart.
Uptrend: connect the , the lowest points. Each bottom higher than the one before.
Downtrend: connect the , the highest points. Each top lower than the one before.
Three points, not two. Two points always make a straight line. That proves nothing. When the price touches the ruler for the third time and respects it, then you have a trend.
Where to lay the ruler. On the candle bodies, not the . The wick is the jump. The body is where the price landed.
The tree. One more comparison, this time with nature. A tree grows its own way. A mango tree grows like a mango tree and gives mangoes. If one day a branch shows up with a different shape and a different fruit, it's not the same tree anymore.
Back to the chart. As long as the price grows while touching the ruler, the trend is alive. When it breaks the ruler and changes shape, it's as if the tree had changed. That trend is over.
Two rulers, the same question. The hand-drawn line and the 20 EMA are two ways to answer the same thing: where is the price going? When the two agree, the trend is real.
Words in this chapter
Bottom
The lowest point of a move.
Top
The highest point of a move.
Wick (shadow)
The thin line above or below the candle's body, showing the high and the low of the period.