Translation under review. The illustrations are still in Portuguese.
"Buy when everyone is scared. Sell when everyone is euphoric."
You stopped in the middle of this chapter.
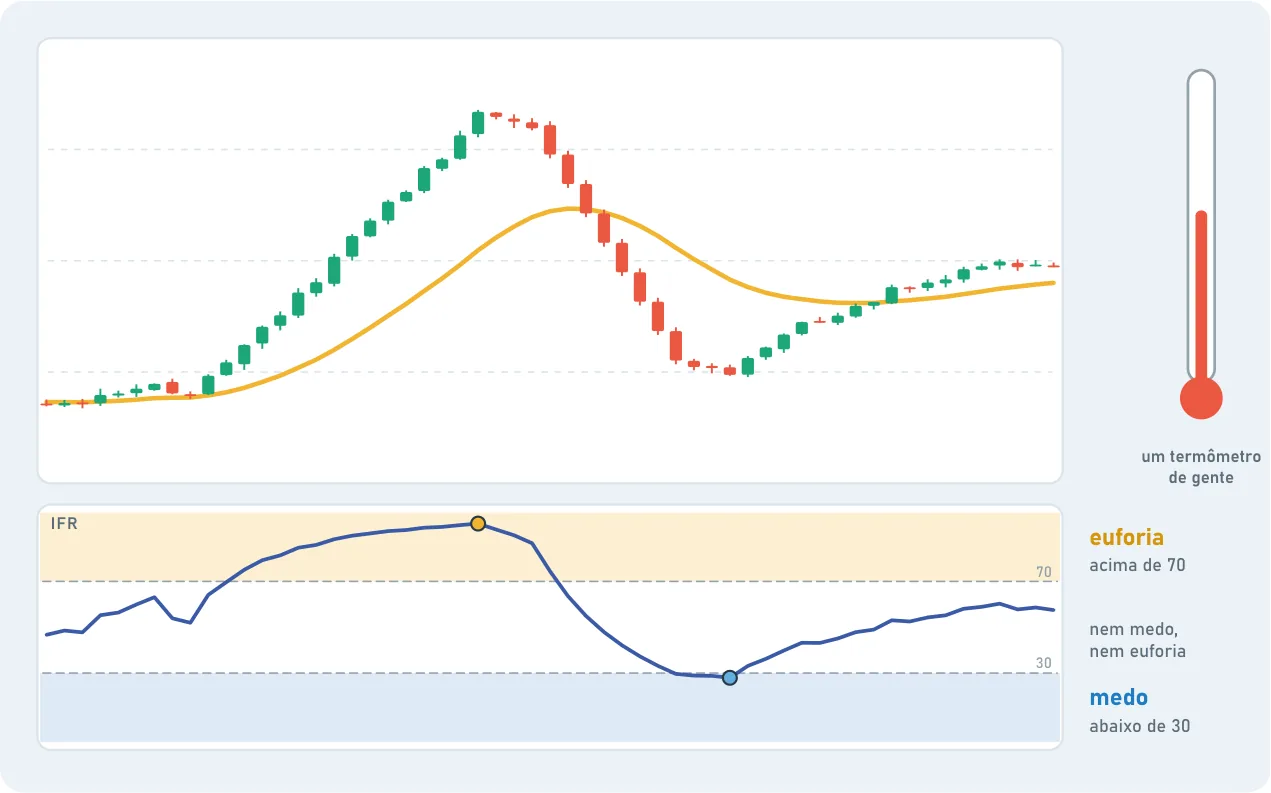
A thermometer for people. The RSI (Relative Strength Index) is a drawing below the chart. Think of it as a thermometer (it's a comparison): instead of temperature, it measures the market's mood, from 0 to 100.
Below 30: lots of people sold, everyone is scared. Oversold.
Above 70: lots of people bought, everyone is excited. Overbought.
In the middle: neither fear nor euphoria.
It works on any . Fractals again.
Why this matters. If there's a drawing that shows when the market is scared and when it's euphoric, we get a clue about when the best investors in the world would be paying attention.
But it's not a button. An RSI at 25 doesn't mean "buy now". If the price is falling, it can fall more, and the RSI can stay down there for weeks.
What we need is confirmation: it fell, and now it stopped falling. Then maybe it's a good buy.
— Sam
The RSI doesn't say "buy". It says "look". After you look, you check the rest: the , the moving average, the line, the other timeframes. Level 3 shows how to put it all together.
Words in this chapter
Timeframe
The time span of each candle: 5 minutes, 1 hour, 1 day.
Trend
The main direction of the price over a period: up, down or sideways.