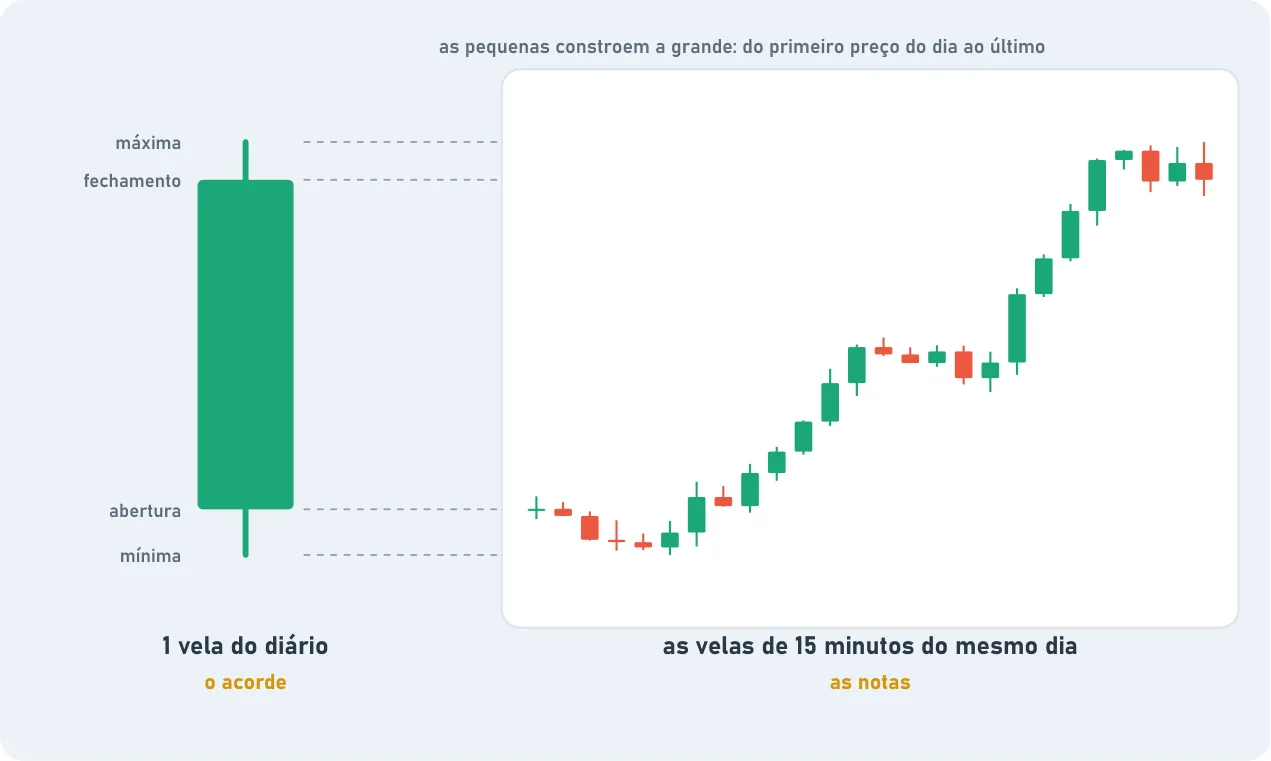
The small candles build the big one. Open the daily chart and pick a candle. Now open the same day on the 15-minute chart. You'll see dozens of little candles. Together, from the first price of the day to the last, they draw exactly that big candle.
To get one candle on the weekly, you need five candles on the daily. To get one candle on the daily, you need many candles on the 15-minute. It's all the same thing, told from different distances.
The note and the chord. To explain it, a comparison with music. A musical chord is when several notes sound at the same time, like when someone plays several guitar strings together. Each note on its own is small. Together, they make the big sound.
Now, back to the chart. What the price does on the small chart is like a note. The big chart is like the chord. A note outside the chord grabs your attention, but the chord is what runs the sound.
The same drawing at every size. This has a name: fractal. It's a drawing that repeats the same way whether you look at it up close or from far away. Nature is full of them: a tree branch looks like a small tree. A piece of cauliflower looks like a whole cauliflower. The chart is a fractal. A rise on the 5-minute chart has the same shape as a rise on the weekly. The size changes, the behavior doesn't, because the same people draw both, with the same fear and the same excitement.
Why this changes everything. Everything you learn in this book works on any . The , the line, the moving average, the RSI, the patterns in Level 3. You learn it once and use it with whatever magnifying glass you want.