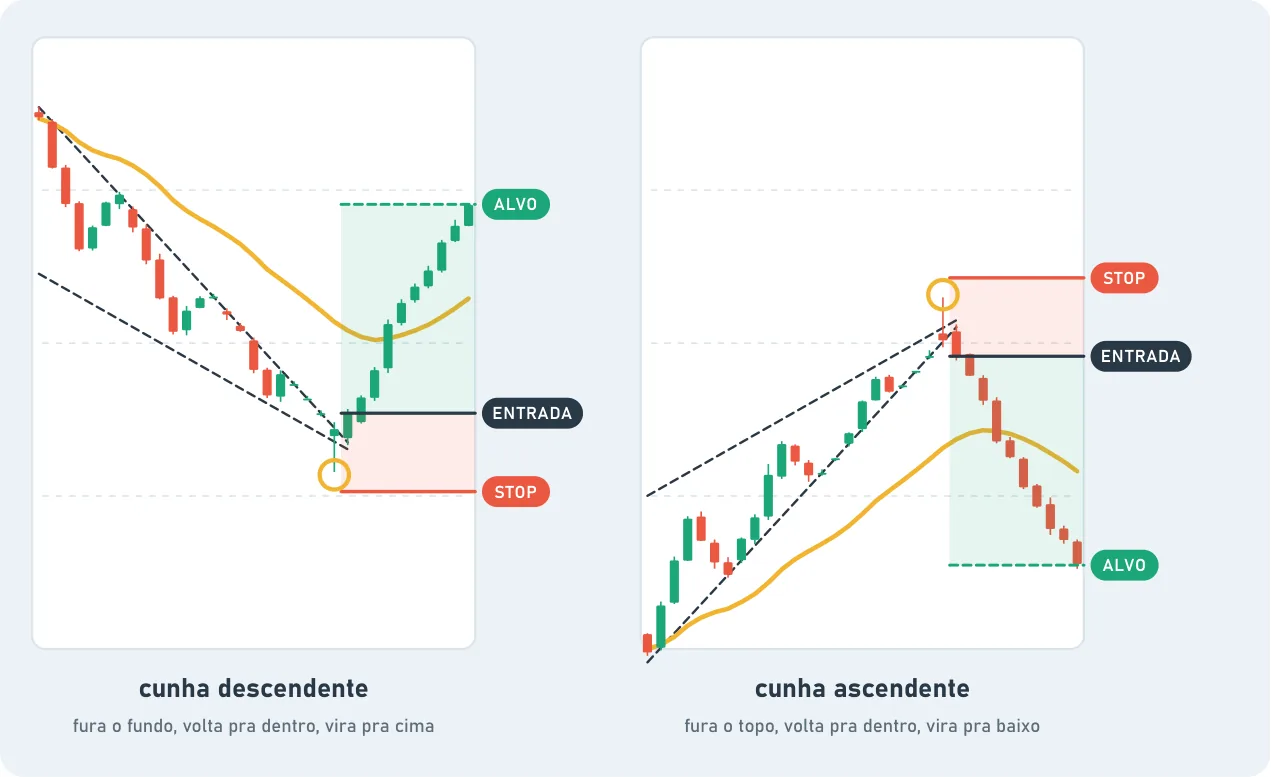
A trend running out of breath. A wedge shows up when the price keeps going in the same direction, but each step gets it less. The two lines close in like a funnel. It's people getting tired.
Falling wedge. Lower and lower tops and bottoms, but each new low lasts less. The price pokes below the bottom and comes right back inside. The sellers are losing strength. A turn up may be coming.
Rising wedge. The mirror image: higher and higher tops and bottoms, but each new high doesn't hold. The buyers are getting tired. A turn down may be coming.
The signal that matters: no follow-through. The price slips past the edge of the wedge for a moment and can't stay there. Did it come back inside? That's the sign of exhaustion.
Pair it with the bigger chart. The best wedges show up when the small pattern agrees with the big picture. If the daily is rising and making a higher low, a falling wedge on the 1-hour chart can be the spot many people watch for an entry. If the daily is falling and making a lower high, a rising wedge on the 1-hour can be the spot to watch for a short.
How to draw it. Connect the main tops and bottoms, touching the candle bodies, not the wicks.
One way to set it up (an example, not a rule).
Entry: when a new low (or high) loses follow-through and the price comes back inside the wedge.
Stop: beyond the extreme point of the wedge, with some room. Wedges can poke through a little before they turn, and a stop that's too tight gets hit early.
Exit: after the breakout, the bigger chart shows the next and levels, which work as targets. The three-part exit is in chapter 16.
Advanced: getting in in parts. You can start with part of the position after the first false break, take some profit on the first bounce and add the rest if the price tests again without strength. Always with the total risk set beforehand.