Translation under review. The illustrations are still in Portuguese.
You stopped in the middle of this chapter.
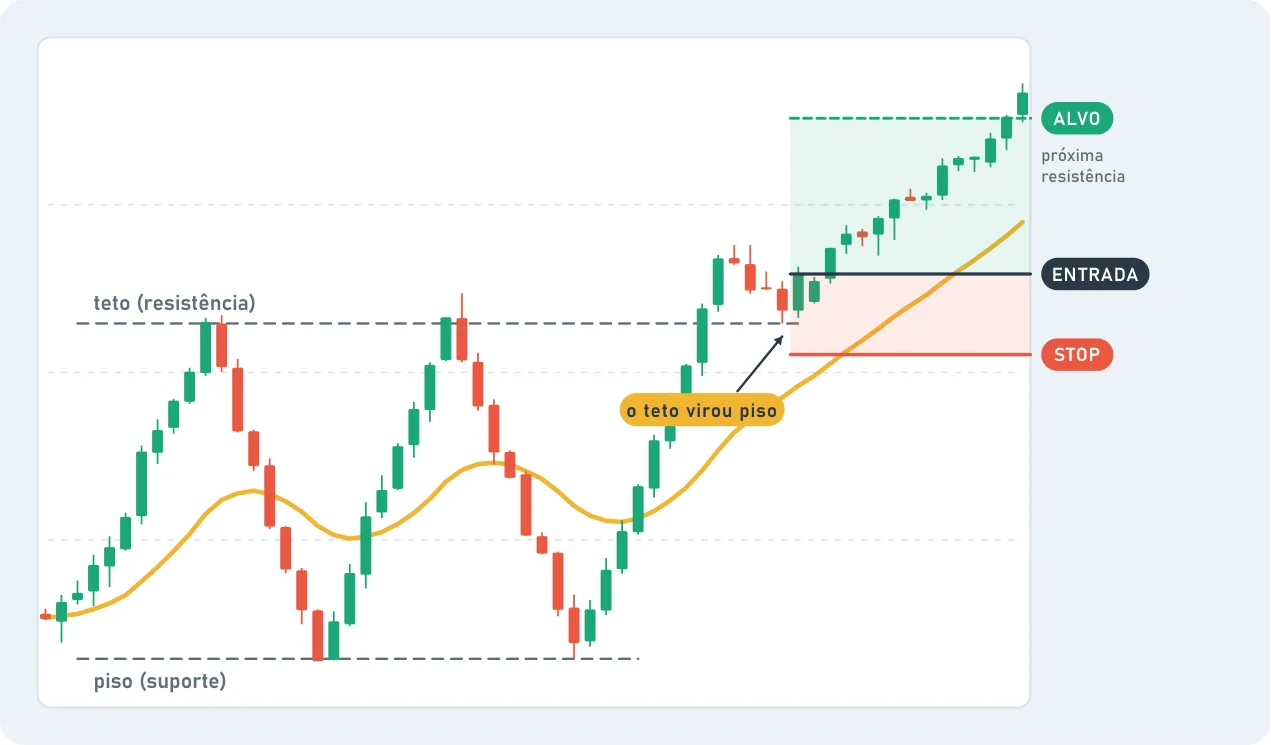
The floor and the ceiling. Support is a zone where the price stopped falling before, because buyers showed up. Resistance is a zone where the price stopped rising before, because sellers showed up. The market remembers these places, because people remember.
Where to look. Previous bottoms and tops. Zones where the price moved sideways for a while. The moving averages you already know. The more times the price has respected a level, the more people are watching it.
It's a zone, not a number. Support isn't an exact cent. It's a range. The price can poke through a little before it comes back.
Four situations, and what many people watch for in each one.
Situation
What many people watch for
Where the idea dies
The price comes back to support
A reaction on a lower ( coming out of oversold, a higher low), before thinking about buying
Just below the zone that invalidates the support
The price reaches resistance
A loss of strength. It's where many people take profit, and where people who trade short look to sell
Just above resistance
The price resistance
Confirmation: a candle closing above it, or the retest, when the old ceiling gets tested from above and holds
Inside the old structure, if the breakout fails
The price breaks support
The same logic in reverse: the old floor becomes a ceiling
Inside the old structure
The ceiling becomes the floor. When resistance is truly broken, it can turn into support. People who sold there regret it, and people who didn't buy want a second chance. It's the same level, with its job switched.
Words in this chapter
Timeframe
The time span of each candle: 5 minutes, 1 hour, 1 day.
RSI (Relative Strength Index)
Relative strength indicator. It measures the speed of rises and drops, from 0 to 100.
Breakout
When the price breaks through resistance on the way up, or through support on the way down.