Translation under review. The illustrations are still in Portuguese.
You stopped in the middle of this chapter.
When the price and the disagree. In Level 2 the RSI was a thermometer of fear and euphoria. Here it gets a second job: showing when the strength behind the price is running out, before the price turns.
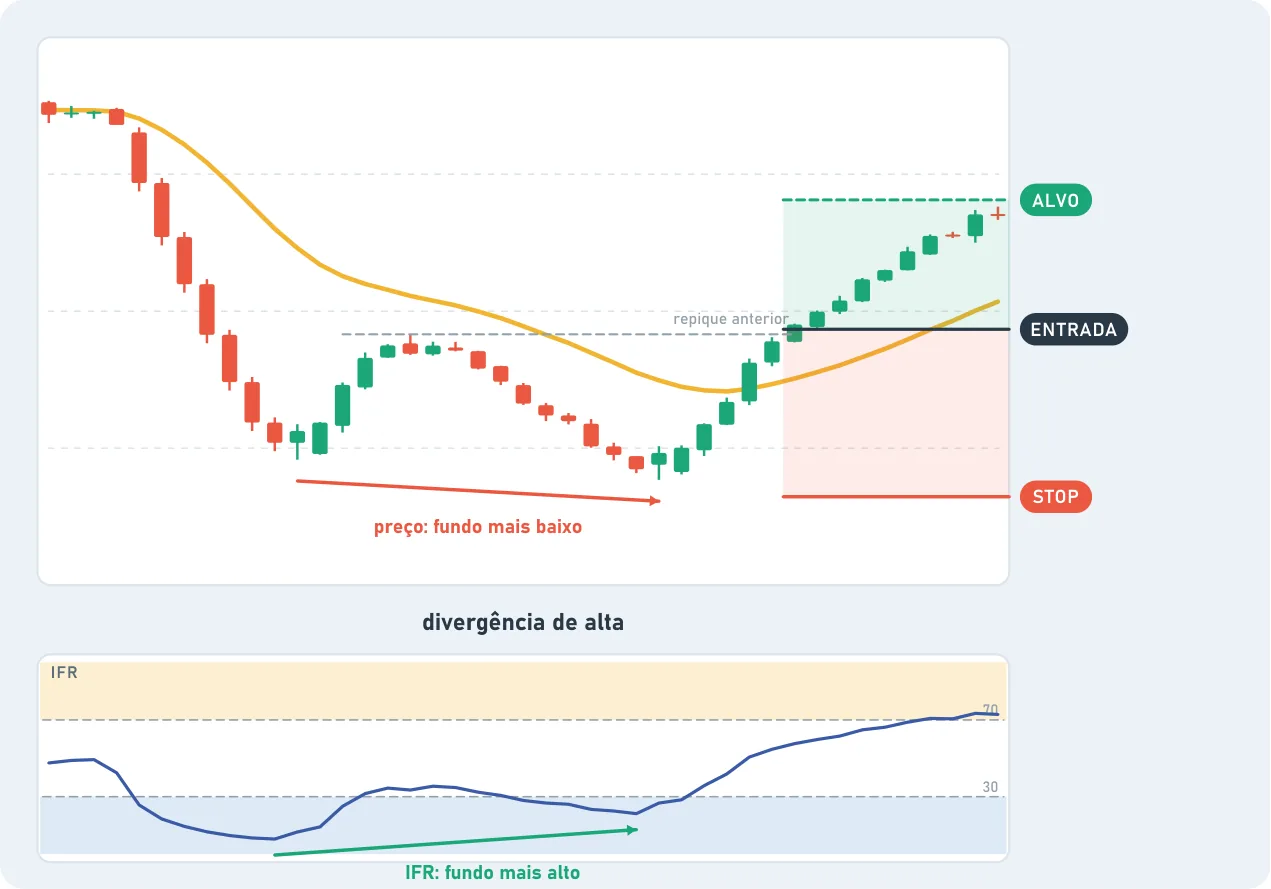
Bullish divergence. The price makes a lower low, but the RSI makes a higher low. The price is still falling, but the sellers have less strength than last time. A turn up may be coming.
Bearish divergence. The price makes a higher high, but the RSI makes a lower high. The price is still rising, but the buyers are getting tired. It's a warning for anyone who's long to look at their profit and their stop.
Stacking the timeframes. Another way to use the RSI: look for the extreme on several timeframes at the same time. If after a strong drop the RSI is below 30 on the 5-minute, the 15-minute, the 1-hour and the 4-hour, and the price has reached an important support, fear is stretched under every magnifying glass. That's when a lot of people keep an eye out for a reaction.
The limits.
Stretched is not a reversal. In a very strong rise or drop, the RSI can stay above 70 or below 30 for days or weeks. Going against a move like that just because the RSI looks stretched is a common way to lose.
Every asset has its own rhythm. One asset bounces near 30. Another, more jumpy, falls to 20 or lower before finding the bottom. Look at that asset's history.
Divergence is a warning, not a trigger. It says "pay attention". The entry comes with confirmation: support, a higher bottom, a breakout.
Words in this chapter
RSI (Relative Strength Index)
Relative strength indicator. It measures the speed of rises and drops, from 0 to 100.